How far back might that ancestor be?
Reader Geoff Gibson has a great question. He’s done all the DNA tests — the now-defunct National Genographic project, AncestryDNA, 23andMe — and his admixture percentages (his ancestral origin estimates) all pretty much agree.
“I’m pretty much a mongrel on my Puerto Rican mother’s side, which estimates almost 30% Iberian ancestry and roughly 8-10% African and 6% Native American ancestry,” he writes. So what he wants to know is: “Is it then possible to extrapolate how far back I may have had a relative who was African or Native?”
Sure.
And nope.
And — well — maybe.
In other words, The Legal Genealogist‘s favorite answer: it depends.
Let’s assume the easiest case. Assume that there is one — and only one — ancestor who could be the source of his African ancestry and one and only one who could be the source of his Native American ancestry — and that ancestor must be on Geoff’s mother’s side. With that assumption, the analysis is pretty easy.
We inherit 50% of our autosomal DNA (the source of these ancestral origin estimates) from each parent. That parent inherited 50% from each of her parents, so what we could expect to get passed through to us from a single grandparent is 25%. Doing the math, we could expect to get 12.5% from a great grandparent, 6.25% from a 2nd great grandparent and 3.125% from a 3rd great grandparent and so on.1
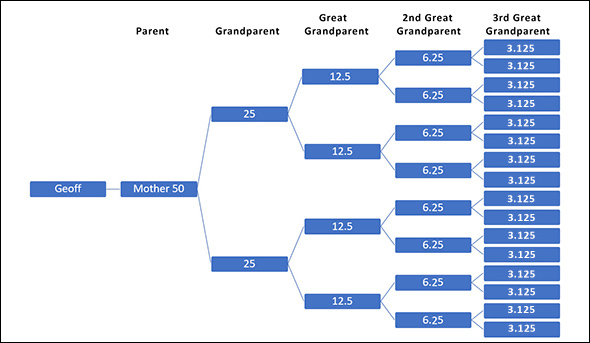
Looking at the chart above, then, to get as much as 8-10% African ancestry, Geoff can look to a great grandparent, and for his Native American ancestry, at 6%, to a second great grandparent.
Easy. Sure.
Except nope.
Problem Number 1: these numbers are not exact for each and every person in each and every generation. Autosomal DNA is passed down to us through a process called recombination: a random mixing of the genes each parent received from each of her parents in each generation.2 And in any given recombination, while the parent is always passing on 50% of her own genes, there may be a little more of grandma — say 30% rather than 25% — and a little less of grandpa.3
So if the numbers are different here — if the grandparent in the African line contributed 30% instead of 25%, and the great grandparent in that line contributed 15% instead of 12.5% — then you might have to go back to a second great grandparent to get your 8-10%.
Problem Number 2: we don’t inherit the genes that give us these ancestral origin admixtures from just one person. While one second great grandparent who was fully Native American could account for Geoff’s Native American ancestry, so too would two third great grandparents who were both fully Native American — say one of the third great grandparents in the pair at the top of the chart and one in the couple at the bottom of the chart. Or four different fourth great grandparents. Or…
The percentages are cumulative, you see. And there’s nothing to say you’re not getting six percent from six people… or all of it from just one. And of course we’re already making a big assumption by not considering Geoff’s father’s side here.
And, of course, Problem Number 3: the percentages in the estimates are called estimates for a reason. They take the DNA of living people — us, the test takers — and they compare it to the DNA of other living people — people whose parents and grandparents and, sometimes, even great grandparents all come from one geographic area. Then they try to extrapolate backwards into time. Nobody is out there running around, digging up 500- or 1,000-year-old bones, extracting DNA for us to compare our own DNA to.
This is less of a problem for Geoff than for most people, since he’s looking at what’s pretty much continental level results — Europe versus Africa versus Asia versus the indigenous Americas — and these admixture percentages are pretty good at that level. They’re not very good at all when we start adding in geopolitical boundaries (northwest German versus southeast England, for example). But even for Geoff the results reflect an estimated range, and a percentage point or two can change the analysis as well.
So the answer is sure, we can say what the closest generation is that could have been the source … and nope, we can’t be sure it all came from that generation … and maybe we could do better if we had a good paper trail.
Bottom line, of course, it depends. How solid is the percentage range? What were the recombinations in Geoff’s ancestral lines? How many ancestors could have contributed to those specific admixtures? What do we know from the records?
Isn’t genealogy fun?
Cite/link to this post: Judy G. Russell, “Extrapolating from those numbers…,” The Legal Genealogist (https://www.legalgenealogist.com/blog : posted 14 Mar 2021).
Note: And a great big hat tip to Ken Kerr who spotted the fact that The Legal Genealogist is (sigh) mathematically challenged. Half of 12.5% is 6.25%, not 6.75%… sigh… The post and the chart have been corrected…
SOURCES
- ISOGG Wiki (https://www.isogg.org/wiki), “Autosomal DNA statistics,” rev. 8 Nov 2020. ↩
- ISOGG Wiki (https://www.isogg.org/wiki), “Recombination,” rev. 14 Apr 2019. ↩
- See “Distribution of genealogical relationships for given amounts of shared DNA,” ISOGG Wiki (https://www.isogg.org/wiki), “Autosomal DNA statistics,” rev. 8 Nov 2020. ↩


How timely! I just got the Ancestry results for my oldest son. According to the paper trail he should be 25% Italian. Results say 15% Southern Italy and 2% Northern Italy.
I am half Irish (1/4 from each parent). His results show 12%. There is 23% Scotland though. Should show lots of English and does, 37% England and Northwestern Europe and % Wales. Even shows 2% for Germanic Europe for the newly discovered German grtgrandparents. So I can work with your chart. Thank you!!!
My cousin Judy Russell on my (Baker side of the family) asks this question: Isn’t genealogy fun? Judy being one of my favorite genealogical cousins makes me want to answer truthfully! MAYBE! IT DEPENDS! If you enjoy beating your head against walls, staring at the computer screen until your eyeballs dry out, etc. Having said this, in all honesty, I have loved every discovery, nothing can match that missing link and finding a long lost cousin you never knew you had!
While DNA may not be precise from one generation to another, mathematics would be precise. If we get 12.5 percent of our DNA from a single great grandparent then it would be 6.25 percent from a single 2nd great grandparent not 6.75 percent as shown in the chart. The next generation would then be 3.125 percent. And yes, genealogy is fun.
And you’re right. Which is why I have the t-shirt that reads: “I was an English major, YOU do the math.” I’ll fix that, and thanks.
Thank you for sharing this quick explanation!